

How to Measure & Monitor Web Vitals within Google Analytics
Google’s Page Experience is defined as good or bad on the basis of 5 factors – Core Web Vitals(CWV) being one of them. These metrics arguably help measure how pleasant or not pleasant the page’s overall experience is for a user.
As per Google’s documentation, there are 5 web vitals namely TTFB, FCP, CLS, FID, and LCP. When measuring page experience, it is only Core Web Vitals that are taken into account which consists of CLS, FID, and LCP.
There are several ways you can measure Core Web Vitals for your page. The tools used for measuring site speed are classified in two categories – field reporting tools (or Real User Monitoring) and lab reporting tools (or Simulated tools). The Lighthouse report you run using Chrome Dev tools or Chrome Extension is a simulated tool. It tries to mimic a real world setting but it is not one truly.
You could use the Core Web Vitals tracker in Google Analytics to act as a field reporting tool and provide data for real users visiting your website.
This post will discuss how to set up Google Analytics for measuring Core Web Vitals and creating reports to get useful insights.
Note: In the article below, examples given also include measuring TTFB and FCP. It’s not necessary to include these two vitals in your report.
Setting Up Google Analytics to Measure Core Web Vitals
Google Chrome released a web vitals library in June 2020 that website owners can install on their website to record the core web vitals for each page load event by real users. This GA setup essentially makes use of this library to get real user numbers.
The steps discussed below make use of Google Tag Manager(GTM) to send data to GA. So you’ll need to be familiar with basic terms in GTM to follow these steps.
Step 1: Insert a code snippet that populates the data layer with CWV values
The purpose of this code snippet is to load the web vitals library and populate the measured metrics into the data layer. The data stored in this data layer is sent to GTM in the next steps.
Remember to update the library’s version in this code should the web vitals library update.
Also make sure that this code is placed in the head section and above the GTM container tag.
<script src="https://unpkg.com/web-vitals@2.0.1/dist/web-vitals.umd.js"></script>
<script>
        function sendToGTM(name, delta, id) {
            ononline = dataLayer.push({
                event: 'web-vitals',
                event_category: 'Performance',
                event_action: name.name,
                event_value: Math.round(name.name === 'CLS' ? name.delta * 1000 : name.delta),
                event_label: name.id
            });
        }
        webVitals.getCLS(sendToGTM);
        webVitals.getFID(sendToGTM);
        webVitals.getLCP(sendToGTM);
        webVitals.getFCP(sendToGTM);
        webVitals.getTTFB(sendToGTM);
</script>
Step 2: Create corresponding data layer variables in GTM
The script above stores 4 variables: event_category, event_action, event_value, and event_label. In your GTM workspace, create 4 data layer variables corresponding to these 4 variables.
Make sure the Data Layer Variable Names exactly match their corresponding variable names in the data layer in the code snippet above.
Step 3: Set up a trigger for the GA tag
This trigger will decide when GTM should send the values recorded to GA. Set up this trigger for the custom event with the event name “web-vitals”. You can use any name but make sure this event name is the same as the one you used in the code snippet above(highlighted in bold).
Step 4: Create a tag that sends data layer values to GA
Create a Google Analytics tag for Event tracking. Under Event Tracking parameters, select the 4 data layer variables you created in step 2.
Now, add a trigger that tells when this tag should fire. For this, add the trigger you created in Step 3.
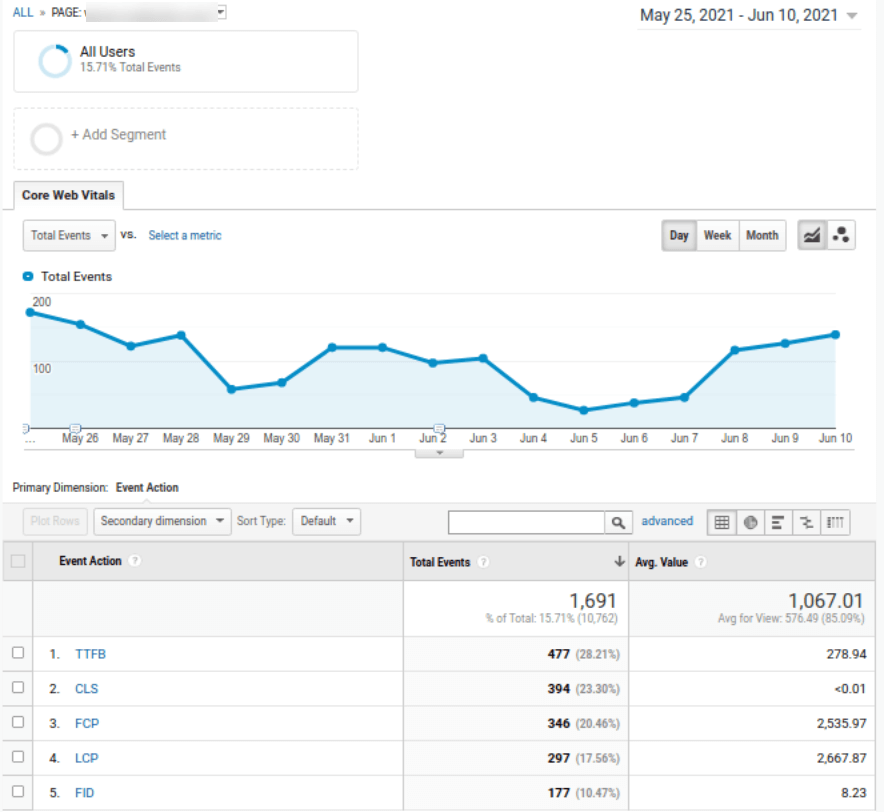
When your GA is set for measuring CWV, you’ll be able to see the web vitals in Behavior > Events. It can take some hours for the data to show in GA reports. Once you have sufficient data collected over time, the report will look something like this:
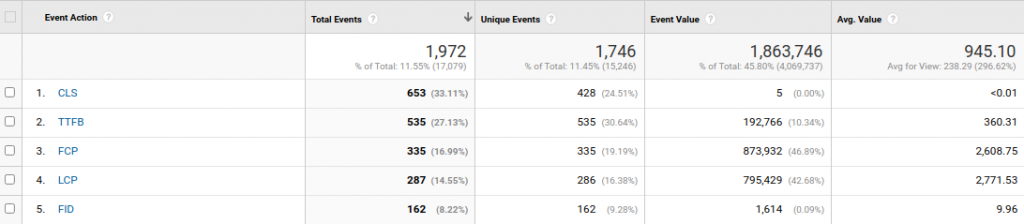
When you drill down on a web vital, you’ll see a list of labels which doesn’t help visualize the web vitals for each page. There are ways you can visualize them better, which are discussed below:
Creating Reports in GA to Visualize Web Vitals
To see web vitals by page in default event reports in GA, you will need to add “Page” as the secondary dimension. This requires adding the secondary dimension each time you open the report, making it inconvenient. That’s why we’ll create custom reports that simplify visualizing and getting important insights quickly.
Custom Report
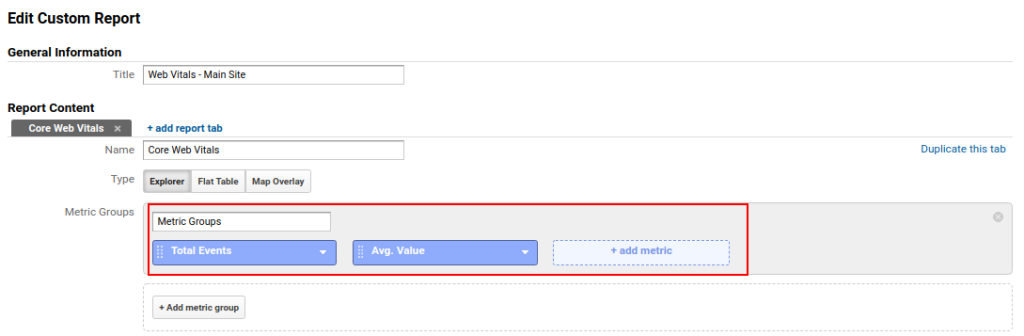
Step 1:
Head to Customization > Custom Reports > + New Custom Report. Give a name to your report, for example, Web Vitals.
Step 2:
Under Metric Groups, add Total Events and Avg. Value. Total Events will help sort your pages in ascending order and you will have the most visited pages on top. Second metric, Avg. Value, will give you a quick overview of vitals before you drill down.
Step 3:
Next, you need to make sure the only events being reported in the report are web vitals. For this, head to Filters and add a filter that includes Event Category with the name you used for your web vitals event category. In the code snippet we used above, this name was Performance.
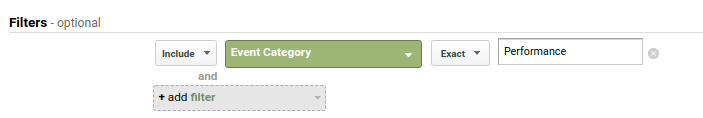
To check which category event name to use, check the script you used to send data to GA. If you used the script shared in the web-vitals library, the Event Category should be ‘Web Vitals’.
Step 4:
Now, set up dimension drill downs to be able to see values of each of the 3 core web vitals in detail. Set them up in the order: Page > Event Action > Event Label

Reasoning behind this drilldown:
It’s needless to mention Page should be the top dimension. Page speed is measured with respect to page, hence chosen as the top dimension.
Event Action consists of core web vitals being measured: LCP, FID, and CLS. This arrangement will show the Total Events and Avg Value for each of these web vitals for the selected page.
The last dimension, Event Label, is used to identify a unique web vital measurement per page load. Regardless of the number of times the page was reloaded, there will be a unique Event Label assigned to the measured metric.
Save the report and check if it was per your expectations. As per the instructions above, you should get a report like this:
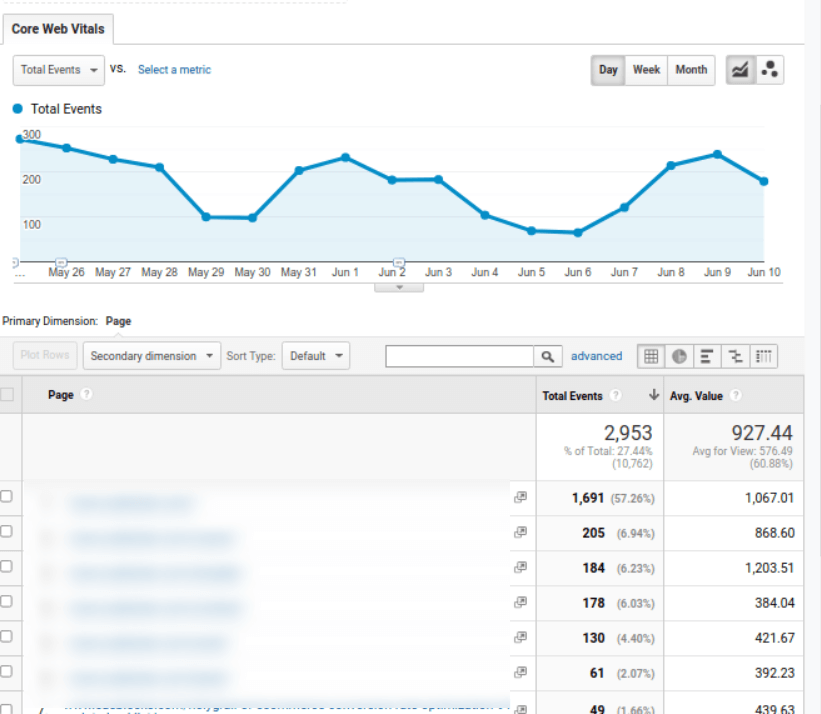
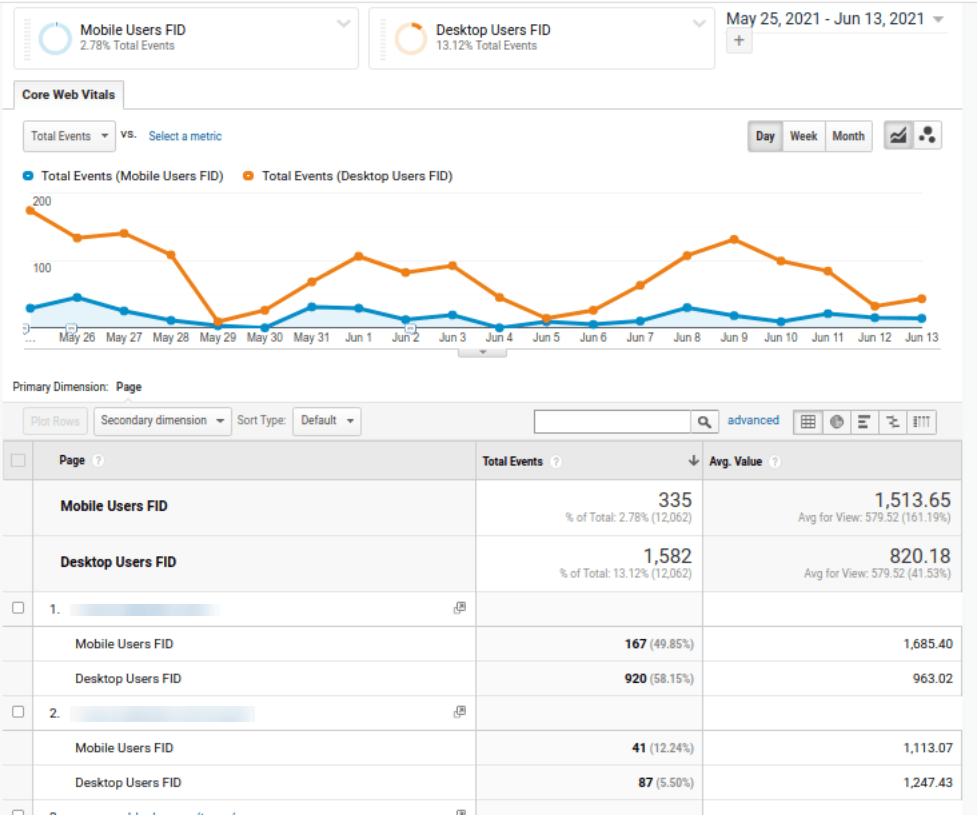
And web vitals per page when you drill down will be as follows:
Drilldown further to a specific web vital and you’ll see Values by Event Label, which basically means, you are seeing values for unique page load events.
Multiple Values for CLS
When looking at the report for CLS, the number of events per Event Label are sometimes more than 1. This is because CLS is measured multiple times as long as the page is live in the browser. GA would show you a sum total of the CLS values calculated throughout the life of that page.
75th Percentile of Values
The web vitals can vary greatly for different ‘real users’. This means that the average value can shift by a big number due to a small number of users with poor web vitals. To classify overall performance of a page, it is recommended to use 75th percentile of all page views. To put it in simpler terms, if 75% of page views meet “good” web vital thresholds, the web page’s web vital performance is considered “good”.
Custom Dashboard
Use GA’s custom dashboard to visualize web vitals values by browser, country and device.
A common differentiator for web vitals in different simulations is device. Web vitals can vary greatly for mobile, desktop, and tablet devices.
Create a handy widget in your custom dashboard that provides a sum-up of avg web vital. To do this, click on + Add Widget in Custom Dashboard. Select Device Category as the dimension, and Avg. Value and Total Events as the metrics. Add a Filter that only shows Event Action LCP.
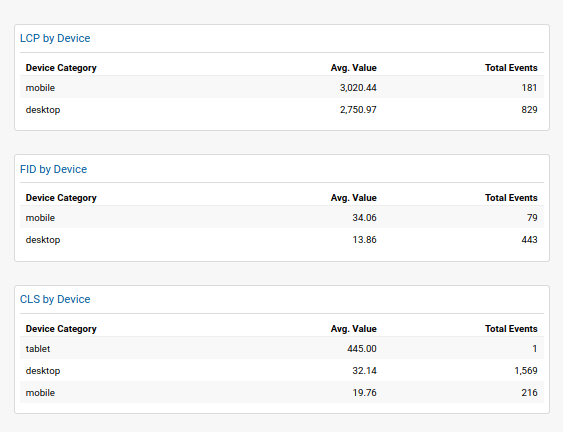
Create two more widgets for FID and CLS. You can also link these widgets to custom reports that show values for the web vital by page and compare segments for mobile and desktop users.
We created a custom dashboard template for core web vitals that you can simply import and make use of in your GA property.
Final Words
With access to real user data in your GA, you can organize and view this data by browser, device, location and even metrics like bounce rate and conversions. Imagine comparing conversions from users with better website experience to users with poor or discovering how many returning users are so because of good page experience on your site.
Happy measuring!
- About the Author
- Latest Posts
I’m a part of CueBlock’s SEO team. I like traveling, reading, and experimenting with new ways in SEO to get the best results.

Harleen Sandhu
I'm a part of CueBlock's SEO team. I like traveling, reading, and experimenting with new ways in SEO to get the best results.
MORE POSTS2 Replies to “How to Measure & Monitor Web Vitals within Google Analytics”
Add a comment
-
Evaluating the Carbon Emissions of Shopify Themes
by Harleen Sandhu
Committing to green claims as a business is a huge promise to deliver on. For ecommerce stores, Shopify is leading …
Continue reading “Evaluating the Carbon Emissions of Shopify Themes”
-
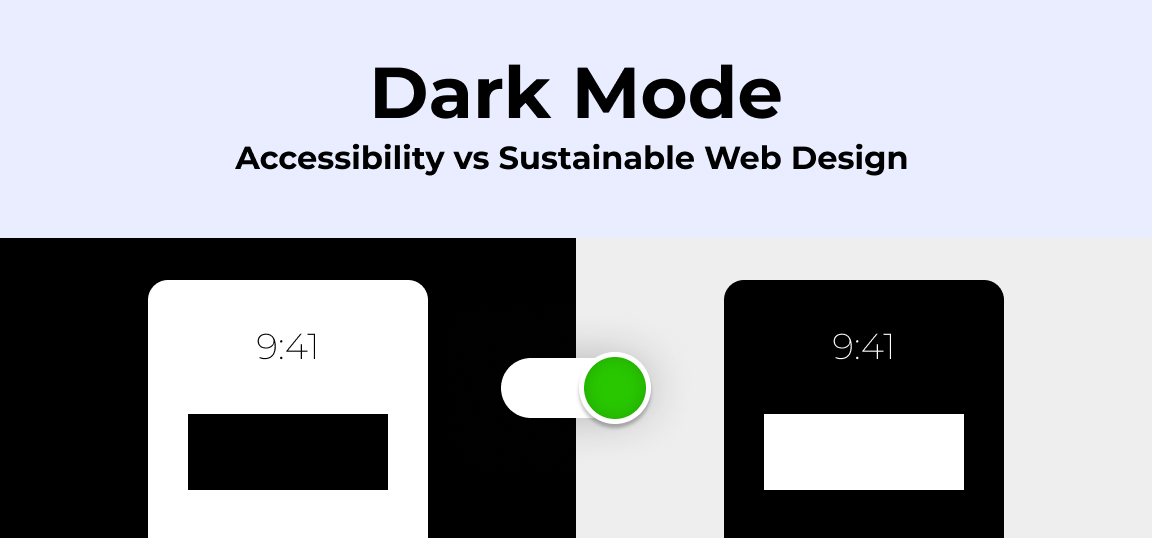
Dark Mode: Accessibility vs Sustainable Web Design
by BalbirIntroduction Dark mode, a feature that lets users switch the color scheme of an app or website to darker colors, …
Continue reading “Dark Mode: Accessibility vs Sustainable Web Design”
-
Discover Essential Sustainable Marketing Principles and Strategies for Ethical Business Growth
by Pancham Prashar
Given the major issues that our world is currently facing, such as pollution and climate change, sustainability becomes an inevitable …
-
Show, Don’t Tell: Demonstrating Transparency in Your eCommerce Store
by Pancham Prashar
For an eCommerce brand committed to good, success goes beyond creating excellent products; it extends to effectively communicating your values …
Continue reading “Show, Don’t Tell: Demonstrating Transparency in Your eCommerce Store”
-
How to Market Sustainable Products Effectively
by Nida Danish
In today’s market, sustainability has evolved from a passing trend to a pivotal consideration for both consumers and businesses. Globally, …
Continue reading “How to Market Sustainable Products Effectively”
-
Decoding B Corp Marketing Challenges: Strategies for Success
by Nida Danish
Today, businesses place high importance on sustainability and ethical practices. For B2B and e-commerce leaders, being a certified B Corp. …
Continue reading “Decoding B Corp Marketing Challenges: Strategies for Success”
This seems outdated, please update !