
Level Up Google Search Console’s(GSC) Performance Report with Google Data Studio(GDS)
GSC is one of the go to tools in any SEO’s arsenal. However, it is not without its shortcomings. This post will discuss the limitations of the performance report feature in GSC and how to overcome them using GDS. These limitations include:
- The number of rows you can view and download.
- The reporting view; you need to open multiple tabs to visualize and match queries and landing pages.
With Google Data Studio, you can do more than just get rid of these limitations:
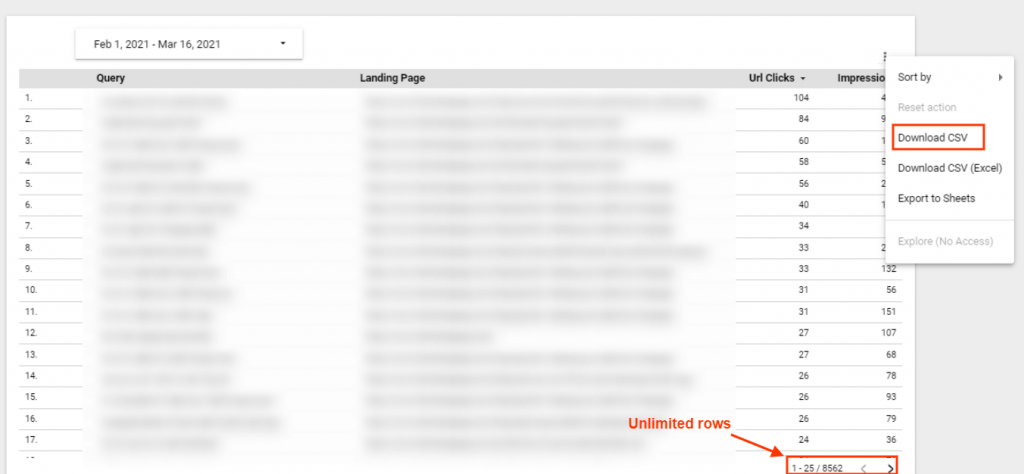
View and export unlimited number of rows
GSC only lets you see and download data for a maximum of 1000 rows. For large, and even medium websites, the number of rows with useful data easily exceeds this number.
One way around is Search Analytics for Sheets. The Google Sheets add-on lets you extract all data that resides in the Search Console API.
The second way is Google Data Studio. To extract all rows, create a new report in GDS and choose GSC as the data source.
Next choose the dimension with respect to which you want to see the varying metrics. Then choose the metrics you want to measure – these could be clicks, impressions, CTR, position, or queries too.
View all the metrics in one report
In GSC, you cannot see both queries and landing pages in the same report.
GDS lets you see queries against landing pages in one report. You can achieve this via Search Analytics for Sheets too, but GDS is prettier.
Set custom filters to exclude unwanted/irrelevant values
In heaps of rows, it’s quite likely there are some values you don’t want to see in your report.
With the help of a filter, you can specify what pattern of values you want to exclude or include in your report. There can be several scenarios where filters can come to your rescue. Here are a few examples:
Use case 1: Exclude queries with few impressions
Set up an exclude filter to exclude queries with a few impressions. This would rid your report of many queries which were mistyped, irrelevant or have a very low search volume.
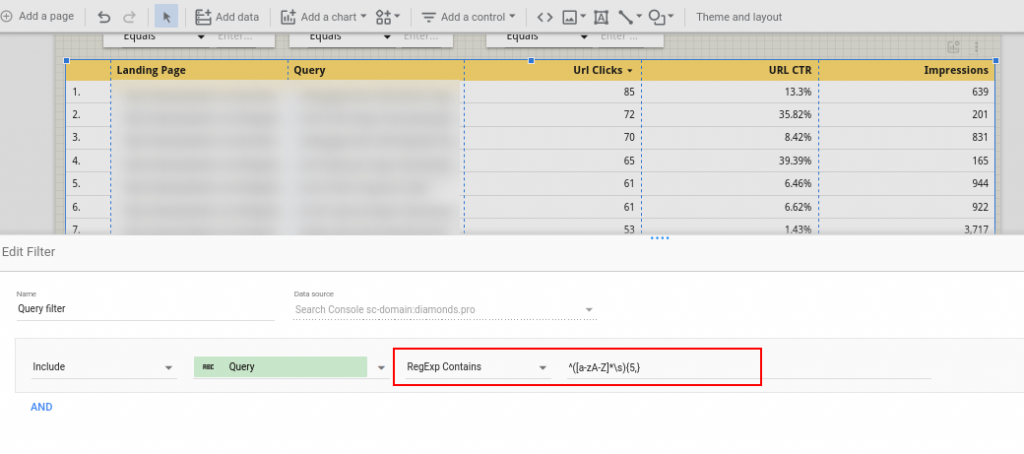
Use case 2: Include only long tail keywords
GDS filters allow the convenience of using Regex, IF condition, and CASE statements to refine your data.
Using Regex, you can exclude queries with less than 5 words. Use this Regex for it: ^([a-zA-Z0-9]*\s){5,}.
Use case 3: Set multiple filters for one metric
GSC doesn’t let you exclude two or more different queries. You can only set one filter per metric. GDS is your savior again. Use the AND and OR operators in filters to get rid of all the values you don’t want to see.
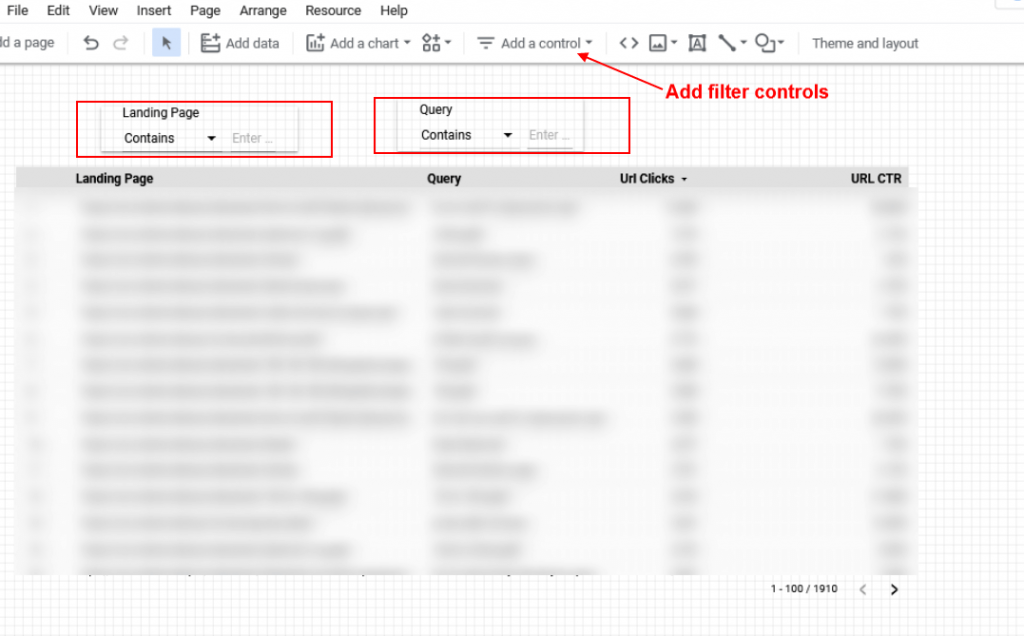
Replicate GSC’s Filter Control
GSC filters let you filter landing pages and queries. You can give the same control in report view with GDS’ filter control feature.
Final Words
Google Data Studio Report can replicate GSC almost completely and be even more insightful. To replace GSC with its GDS replica completely, you may need one additional step. To see both “landing pages” and “position” in one report, you’d need to blend data from both site impressions and URL impressions.
GDS’ ability to access search console data from its API is fantastic and gives you great insights into your website’s search performance. With the power of Regex, IF, and CASE statements you can use GDS to make your filters and calculated fields more efficient and concise.
- About the Author
- Latest Posts
I’m a part of CueBlock’s SEO team. I like traveling, reading, and experimenting with new ways in SEO to get the best results.

Harleen Sandhu
I'm a part of CueBlock's SEO team. I like traveling, reading, and experimenting with new ways in SEO to get the best results.
MORE POSTS-
Evaluating the Carbon Emissions of Shopify Themes
by Harleen Sandhu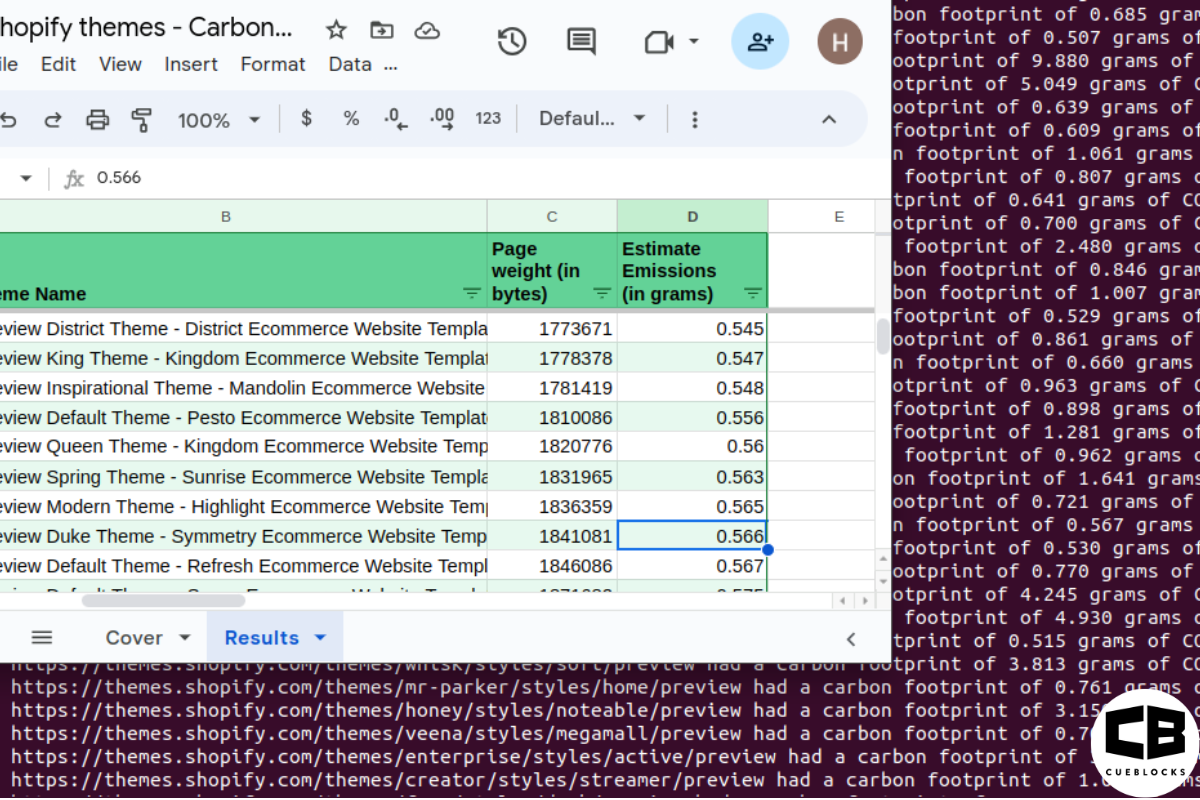
Committing to green claims as a business is a huge promise to deliver on. For ecommerce stores, Shopify is leading …
Continue reading “Evaluating the Carbon Emissions of Shopify Themes”
-
Dark Mode: Accessibility vs Sustainable Web Design
by BalbirIntroduction Dark mode, a feature that lets users switch the color scheme of an app or website to darker colors, …
Continue reading “Dark Mode: Accessibility vs Sustainable Web Design”
-
Discover Essential Sustainable Marketing Principles and Strategies for Ethical Business Growth
by Pancham Prashar
Given the major issues that our world is currently facing, such as pollution and climate change, sustainability becomes an inevitable …
-
Show, Don’t Tell: Demonstrating Transparency in Your eCommerce Store
by Pancham Prashar
For an eCommerce brand committed to good, success goes beyond creating excellent products; it extends to effectively communicating your values …
Continue reading “Show, Don’t Tell: Demonstrating Transparency in Your eCommerce Store”
-
How to Market Sustainable Products Effectively
by Nida Danish
In today’s market, sustainability has evolved from a passing trend to a pivotal consideration for both consumers and businesses. Globally, …
Continue reading “How to Market Sustainable Products Effectively”
-
Decoding B Corp Marketing Challenges: Strategies for Success
by Nida Danish
Today, businesses place high importance on sustainability and ethical practices. For B2B and e-commerce leaders, being a certified B Corp. …
Continue reading “Decoding B Corp Marketing Challenges: Strategies for Success”