

How to measure site speed correctly #WebPerformance
Your site speed concerns are justified!
Site Speed is crucial for any website today. There are no two ways about this. The emphasis is well placed as it is a crucial part of User Experience and now, SEO too.
After Google’s Speed Update (rolled out in July 2018) this emphasis became more profound with every online business trying to speed up their websites. Google announced a while back that it will be using Core Web Vitals for ranking starting around June 2021. This will be known as Page Experience Update. In fact, during the recent Google I/O 2021 conference, Google said that they will be rolling out the Page Experience update to Desktop first.
Before we jump to “how we can improve the speed of a website”, let’s put a vague definition to what we will be referring to as speed.
What is Site Speed?
If you look at the 2 filmstrips from Smashing Mag below, which one do you reckon loaded faster for a user?
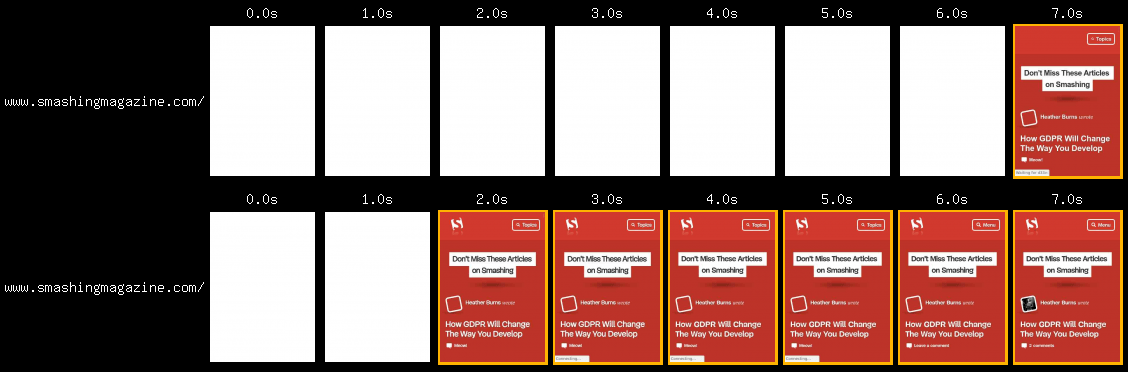
Credits: Google Web Fundamentals
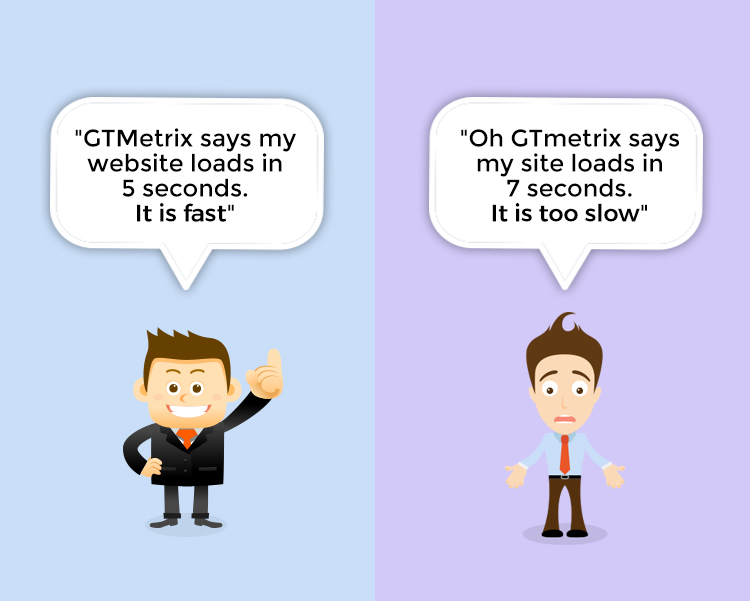
Both times, the site is fully loaded in about 7 seconds for a user. This 7 second is known as Actual loading time.
However, the second time, a user feels the site loaded faster. This feeling of loading faster is called Perceived loading time.
Perceived loading time vs Actual loading time
Often, developers spend a lot of time improving the Actual loading time. The Actual loading time is no doubt important but if your site shows a blank screen for 5 seconds, not many users are going to wait for it to load entirely.
Thus, the first step towards a faster website is to understand that…
Perceived loading time is as important, if not more,
 than Actual loading time
As per Google, the following metrics are important to measure with the ones marked in bold considered most important.
- Largest Contentful Paint (LCP)
- Time to Interactive (TTI)
- Cumulative Layout Shift (CLS)
- First Contentful Paint (FCP)
- First Input Delay (FID)
- Interaction to Next Paint (INP)
- Total Blocking Time (TBT)
- Time to First Byte (TTFB)
Find the entire list of metrics here.
The metrics Largest Contentful Paint (LCP), Time to Interactive (TTI), and Cumulative Layout Shift (CLS) are known as Core Web Vitals.
Measuring Site Speed (the right way)
The usual way a majority of site owners perform quick speed tests is incorrect. If you are looking at, say, Pingdom the results look something like this:
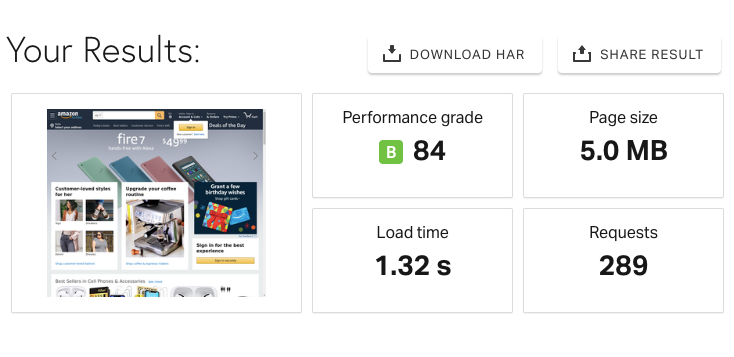
A user looks at the load time in seconds (1.32 s here) and determines if it’s fast or slow. What’s missing are the conditions this test was performed on. Was this test simulated on the latest Macbook Pro with the highest possible configurations or was it performed on an Intel Celeron based Netbook (which have low configurations usually)? This test was performed from San Francisco but what if your site gets traffic mainly from Dublin, Ireland?
How a typical user goes about measuring speed: [wrong method ]
- Self-realization or inspiration from an article regarding the importance of speed
- Googles the best tools to measure site speed
- Tests PageSpeed Insights(PSI), WebPageTest (WPT), GTMetrix, Pingdom, etc
- Notes down the scores or grades or number of seconds and sends it to his developer to improve upon.
- Tests for changes in grade after implementation and iteratively sends it to developers
What’s wrong with the typical approach to measuring speed?
A lot… to be honest!
We often forget some basic points while testing site speed. Here’s a quick refresher -:
- Test Device matters… a lot
Selecting the correct device for testing is important. What we must understand is that websites or webpages are basically lines of code. The better the device, the faster this code can be executed. In simple terms, a powerful laptop/mobile will load websites faster than its less powerful counterparts.
If the majority of your user base uses outdated and not the latest ultra smartphones, then you should test your site on a device that has similar specs to that of your majority users. - Do not forget to measure speed on mobile
For most sites, mobile pulls more traffic than desktop. But, when it comes to testing for speed, most of us check it only for desktop. Google Pagespeed Insights (PSI) offers a speed score for Desktop and Mobile in a visible fashion and thus proves more useful than some other tools in this aspect. - Use specific settings while testing
Most of us tend to test for site speed with the default settings of the tool we use. For instance:- WebPageTest (WPT) is set to Dulles, VA(Virginia) with an emulated device as Motorola G (Gen 4), Chrome as the browser, 4G connection with 9Mbps and 170ms latency. (screenshot below)
- GTMetrix is set to Vancouver, Canada with Chrome as the browser and Desktop environment. The default connection is “Unthrottled Connection”, but you can only alter it if you sign up with GTMetrix.
- Pingdom uses San Francisco, USA as a default location. Connection information can’t be seen anywhere on the page
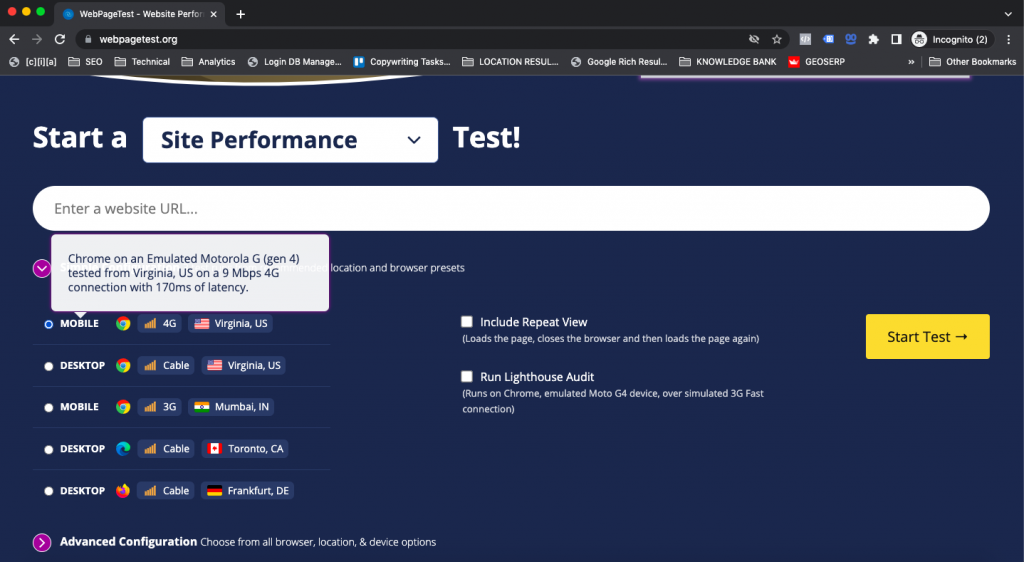
What settings to use while measuring site speed?
Measuring site speed depends, to some extent, on the tool used to measure it. The general concept remains similar for each though:
- Location: Use your main audience’s location for testing
- Device: As stated above, test the site speed for both mobile and desktop. Choose the devices closer to your audience base.
Small tip – If you have Google Analytics (GA3 or UA) installed on the site, you can go to Audience > Mobile > Devices to find out what are the most common devices used by your visitors. Try to find the closest matching device for conducting your test. WPT offers a wide range of devices.
For GA4, go to User > Tech > Tech Details: Device Models - Connection: If using mobile, use 3g Fast or 4g Slow. For desktop, use Broadband/Cable. Unthrottled connection would be the fastest. So, if you are testing your webpage on Unthrottled connection, you may get better results but it is unlikely that your visitors will receive the same kind of connection speed in real life.
- Number of tests: Always test more than once for each device and calculate the average.
- Pages to be checked: Check more than your homepage. This is a classic mistake. Most website owners check the homepage URL but not the remaining pages. If you can’t check it all, at least try and check some common templates like category pages, product pages, etc.
Let our team check the setting preferences for your site. Send us your requirements for site speed optimization and we’d love to chat with you over a free 30-minute consultation.
Synthetic and RUM Tests
Speed tests are measured using the following 2 types of tests:
- Lab Test or Synthetic tests
- Field Test or Real User Monitoring
Synthetic tests are the ones that run in a simulated environment. For e.g. the Lighthouse tool.
RUM stands for Real User Monitoring. These are tests and measurements performed in real-world conditions. CRUX (Chrome User Experience Report), Core Web Vitals tracking in Google Analytics, Akamai mPulse are some ways you could get your hands on RUM data,
Synthetic tests show stats about how a website would perform under a simulated environment. Think of mileage tests conducted by car manufacturers claiming a mileage of X kilometers per liter or Y miles per gallon. In the real world, these numbers are rarely the same. Sometimes, they are too low than what is claimed by the manufacturer and in some cases, the mileage is better than the company claimed stats.
Following the same analogy, RUM data would be if the car manufacturer were to collect mileage data from a good share of its customers and then analyze the numbers.
Imagine that your website’s main audience is using an old version of the iPhone and you’re running WPT and other tests by the standards of iPhone X (which is more powerful than some Macbook 2017 models), then you might be on the wrong track. Google claims claimed to use the Moto G4 as the default emulation device.
Note: Lighthouse powers a part of the PageSpeed Insights report. The latest Lighthouse report uses Nexus 5X as the emulation device.

How do most users view site speed data?
What does site speed data actually look like?
The following chart is from a website’s Chrome User Experience report from Jan 2020.
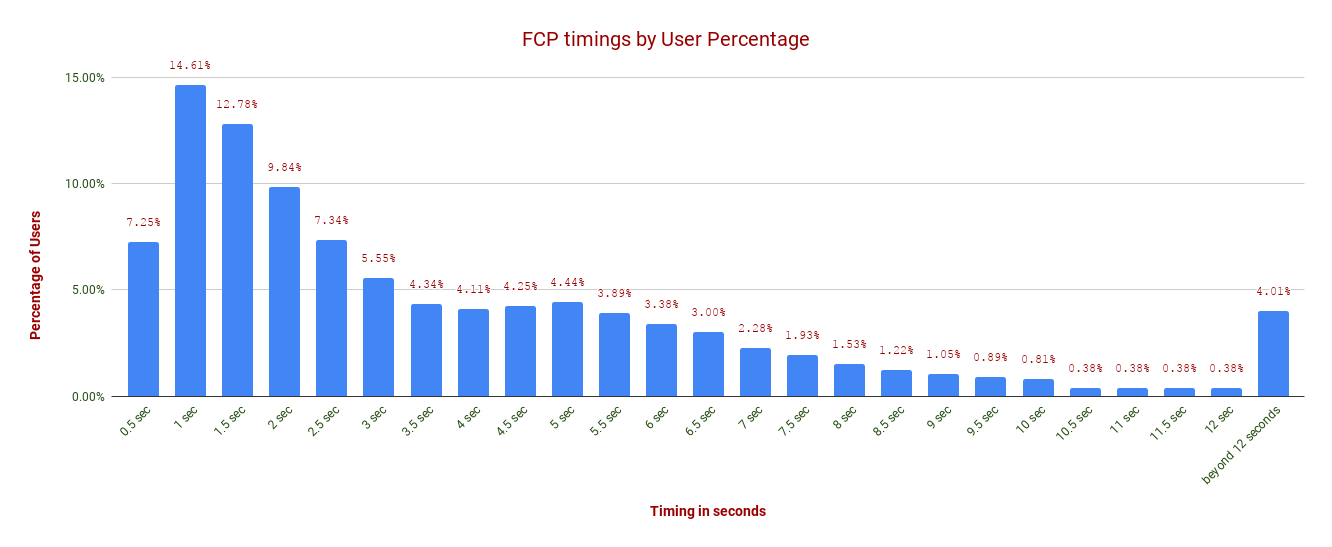
As you can see, for about 4% of users, the First Contentful Paint takes more than 12 seconds. This, in simple terms, means things start loading into browser view after a 12-second mark. Even the thought is excruciating, no?
Once we have a better understanding of what we were doing wrong so far, let’s see how we can do things right.
Desktop or mobile, don’t let speed affect the user experience for your audience. Want us to review your site speed. Drop in a line and our team will get back to you.
How to measure site speed correctly?
Do not chase scores. Try to get all boxes checked
This is simple to understand but hard to follow. You can run any tool available out there and there’s a good chance your scores will vary each time you run a test. Hence, try to get as many checkboxes ticked as you can instead of chasing scores. The scores will follow.
Understand what’s more important to your user
The perception of speed varies for each site. For Twitter what matters might be time to show the tweet content. For news and media sites like The Guardian, showing the headline first might be of utmost importance. For your site, it might be the image of your product. Having said that, displaying the hero elements (main banner in the first scroll) gets you good marks in speed testing tools.
Do not ignore perceived speed
Most site owners tend to improve the actual loading time. While this isn’t wrong, it is extremely important that site owners look at perceived loading time. Metrics like First Contentful Paint (FCP), First Meaningful Paint (FMP), etc help you estimate how you perform for perceived speed.
Get your settings right
Do not make the novice mistake of testing on default settings. You can easily find out what kind of devices your customers use. Pay attention to your customer demographics. Use Google Analytics to find this information and then test accordingly.
Tip – For general benchmarks, I personally like to run all initial desktop tests with browser set as Chrome, Network set to Cable (slow one from the available options). For mobile screens, while Google’s lighthouse runs on Moto G4 with Slow 3G as default. It is good for stress testing but since most of our clients’ customers use 4G, I prefer to use 4G for basic benchmark testing and the mobile device to at least a Samsung Galaxy S8 or iPhone 8. WPT being my preferred speed testing tool.
Pay attention to Page Experience report in Google Search Console
The Page Experience update is not solely about Core Web Vitals(LCP, FID, CLS). It includes mobile usability, security issues and implementation of HTTPS too. To help users out, Google provides details about all of these elements within Google Search Console.
Check more than the homepage
Test your most important pages. Test your category pages. You need not check the entire site (there’s no harm though) but test multiple pages and test them more than once.
Talk to your developers
Do not just send a GTMetrix report to your developers. It is critical that they understand what is important for you (and your customers) and then try to work towards the common goal. There will be several instances when the tools give out suggestions that can not be implemented or are hard to implement, such as handling 3rd party scripts. Analyze if you are okay with removing that chat script from a page to improve your speed or if it is truly helping you with conversions.
Bottom line
In conclusion, we must understand how to measure speed correctly before we begin addressing our site speed issues. Data helps us understand what is important for the users and under which generic conditions they interact with your site on what devices. Once you have a better understanding of what the most important elements are, speak to your developers about how you can speed up the loading time of these elements.
Furthermore, we suggest not relying solely on Synthetic Tests. on Synthetic tests. Instead, establish ways to gather Real User data and review site speed reports in Google Analytics. Try to implement as many optimizations suggested by speed tools as possible, but do not fuss over the final score too much. And most importantly, don’t stress only on actual loading speed. Pay attention to perceived speed too.
Check out our case study on site speed optimization done for one of our clients, WomansWork, and drop us a line with your site-speed optimization requirements so we can get your site up-to-speed!
- About the Author
- Latest Posts
I am part of the CueBlocks Organic Search(SEO) team. I love playing football and reading about Technical SEO.

Rajiv Singha
I am part of the CueBlocks Organic Search(SEO) team. I love playing football and reading about Technical SEO. LinkedIn
MORE POSTS-
Evaluating the Carbon Emissions of Shopify Themes
by Harleen Sandhu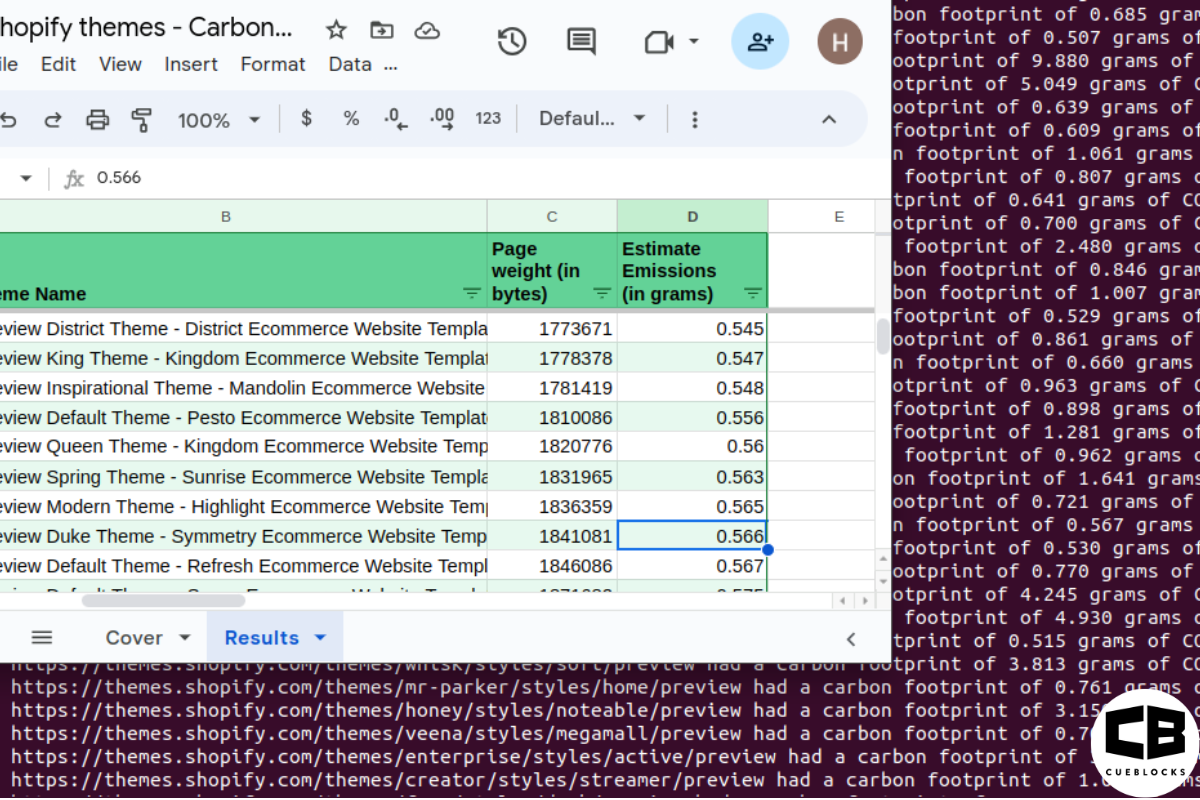
Committing to green claims as a business is a huge promise to deliver on. For ecommerce stores, Shopify is leading …
Continue reading “Evaluating the Carbon Emissions of Shopify Themes”
-
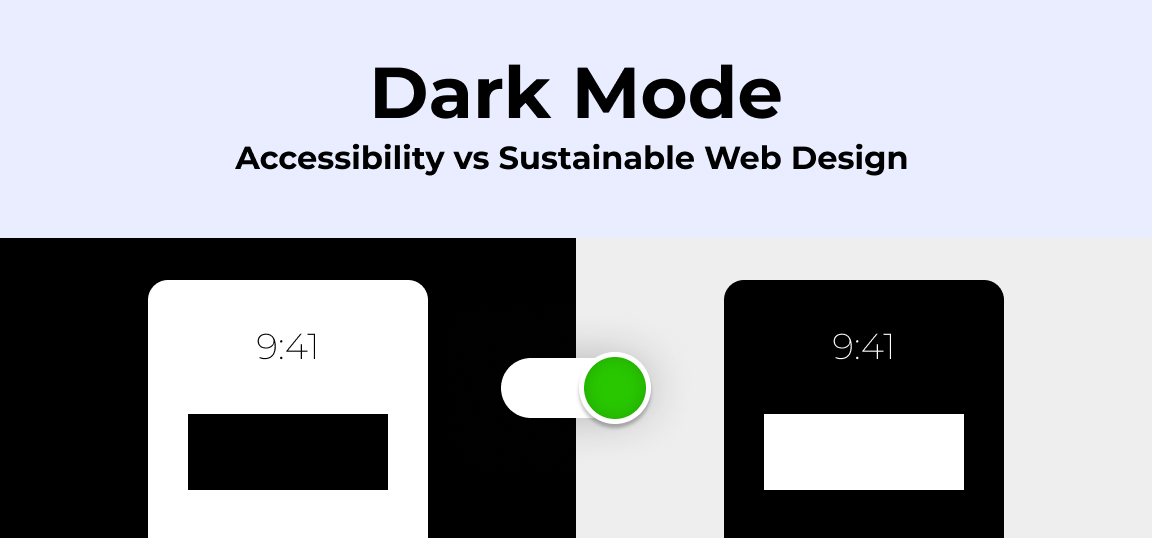
Dark Mode: Accessibility vs Sustainable Web Design
by BalbirIntroduction Dark mode, a feature that lets users switch the color scheme of an app or website to darker colors, …
Continue reading “Dark Mode: Accessibility vs Sustainable Web Design”
-
Discover Essential Sustainable Marketing Principles and Strategies for Ethical Business Growth
by Pancham Prashar
Given the major issues that our world is currently facing, such as pollution and climate change, sustainability becomes an inevitable …
-
Show, Don’t Tell: Demonstrating Transparency in Your eCommerce Store
by Pancham Prashar
For an eCommerce brand committed to good, success goes beyond creating excellent products; it extends to effectively communicating your values …
Continue reading “Show, Don’t Tell: Demonstrating Transparency in Your eCommerce Store”
-
How to Market Sustainable Products Effectively
by Nida Danish
In today’s market, sustainability has evolved from a passing trend to a pivotal consideration for both consumers and businesses. Globally, …
Continue reading “How to Market Sustainable Products Effectively”
-
Decoding B Corp Marketing Challenges: Strategies for Success
by Nida Danish
Today, businesses place high importance on sustainability and ethical practices. For B2B and e-commerce leaders, being a certified B Corp. …
Continue reading “Decoding B Corp Marketing Challenges: Strategies for Success”
12 Replies to “How to measure site speed correctly #WebPerformance”